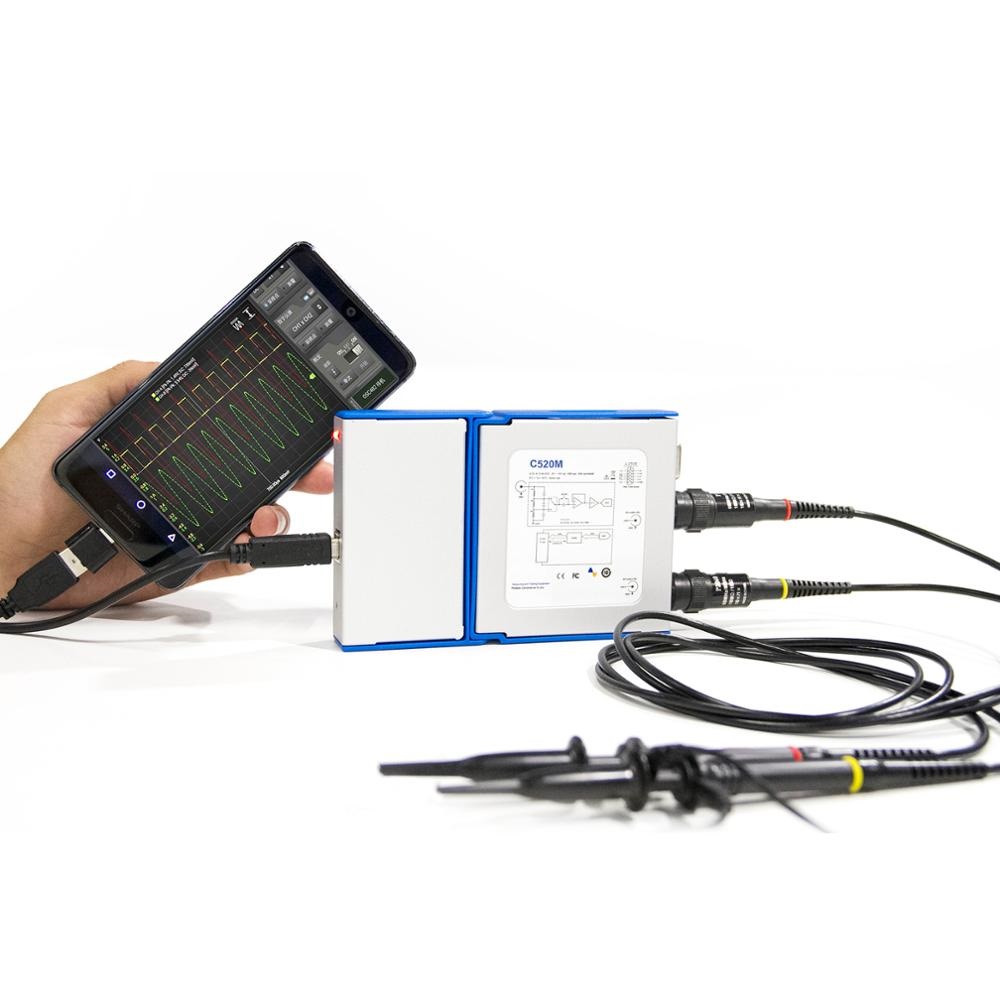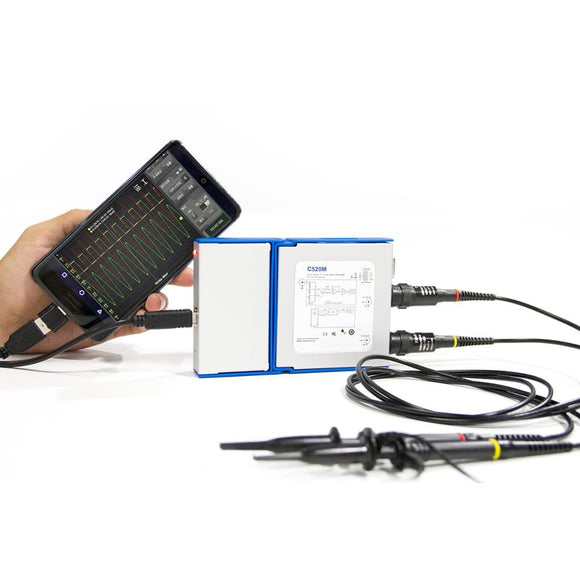
Virtual Digital Handheld Oscilloscope can connect Android&PC 2 Channel Bandwidth 20Mhz/50Mhz Sampling Data 50M/1G
Model: |
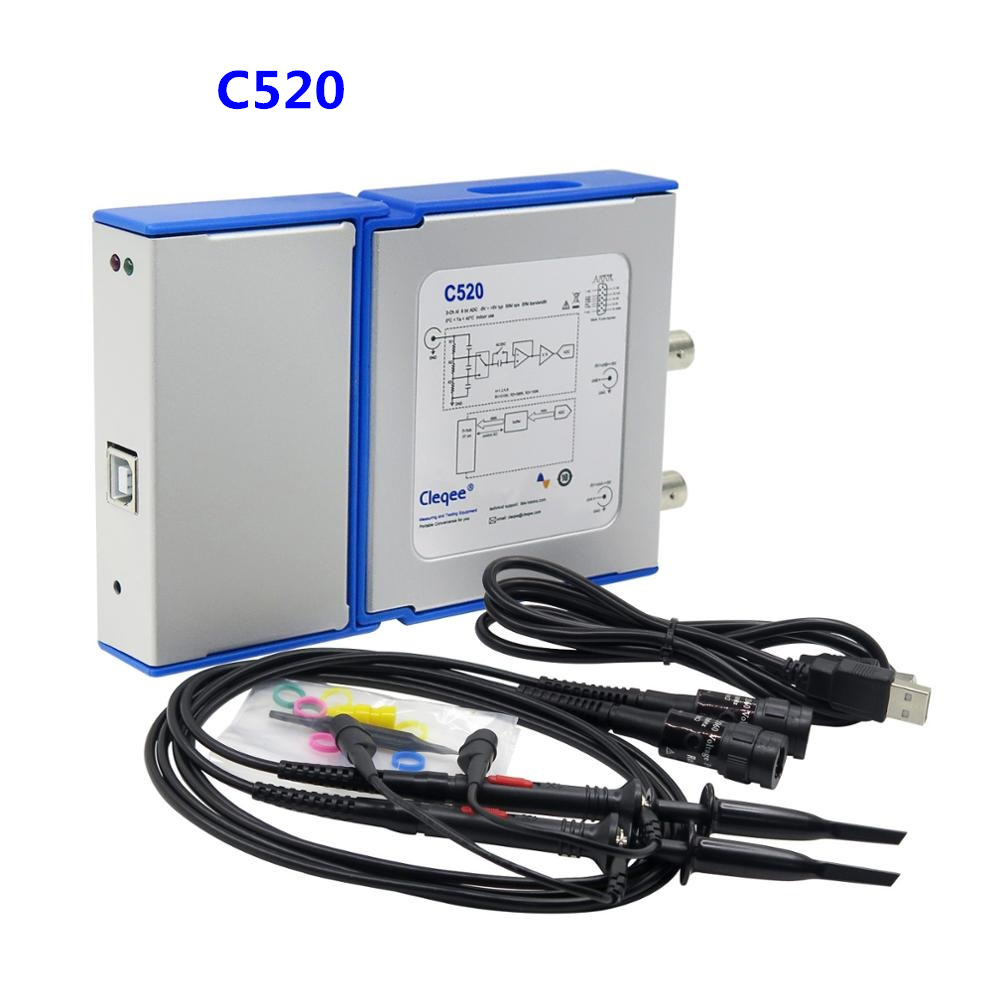
C520 |
C520M |
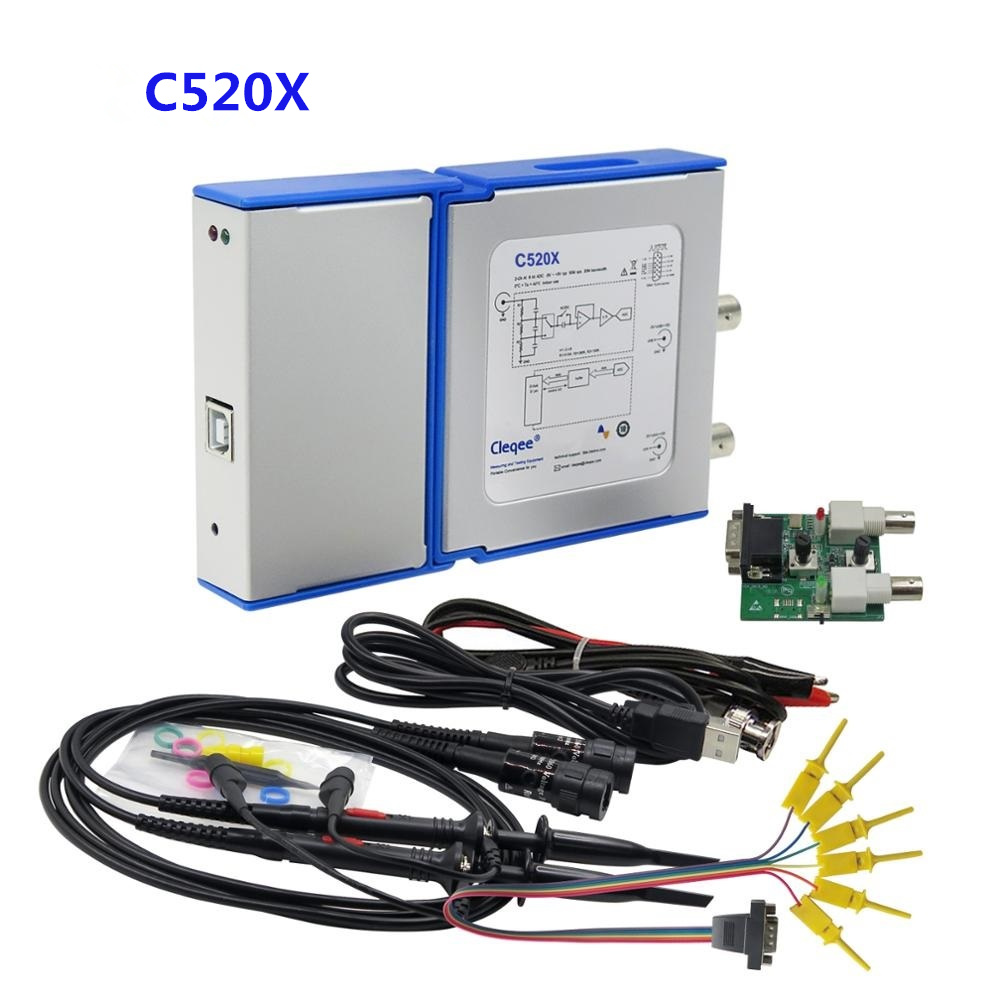
C520X |
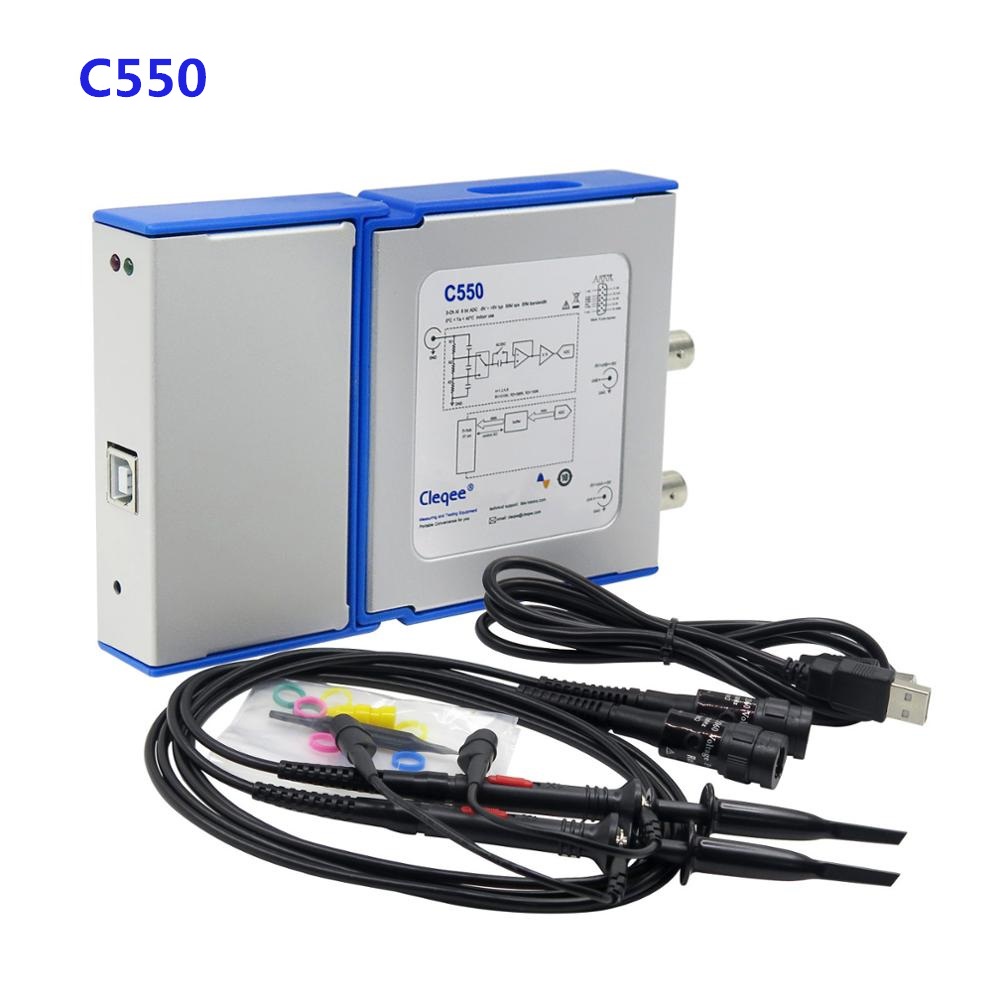
C550 |
Input channels: |
2 |
2 |
||
Maximum sampling rate (S/s): |
50M |
1G |
||
Bandwidth (−3 dB): |
20M |
50M Hz |
||
FFT: |
YES |
YES |
YES |
YES |
Data logger: |
YES |
YES |
YES |
YES |
I/O extension: |
YES |
YES |
YES |
NO |
Serial bus decoding: |
NO |
NO |
NO |
YES |
Hardware trigger: |
NO |
NO |
NO |
YES |
Ext trigger module support: |
NO |
NO |
NO |
YES |
Signal generator module support: |
NO |
NO |
YES |
NO |
Logic analyzer module support: |
NO |
NO |
YES |
YES |
Requirements
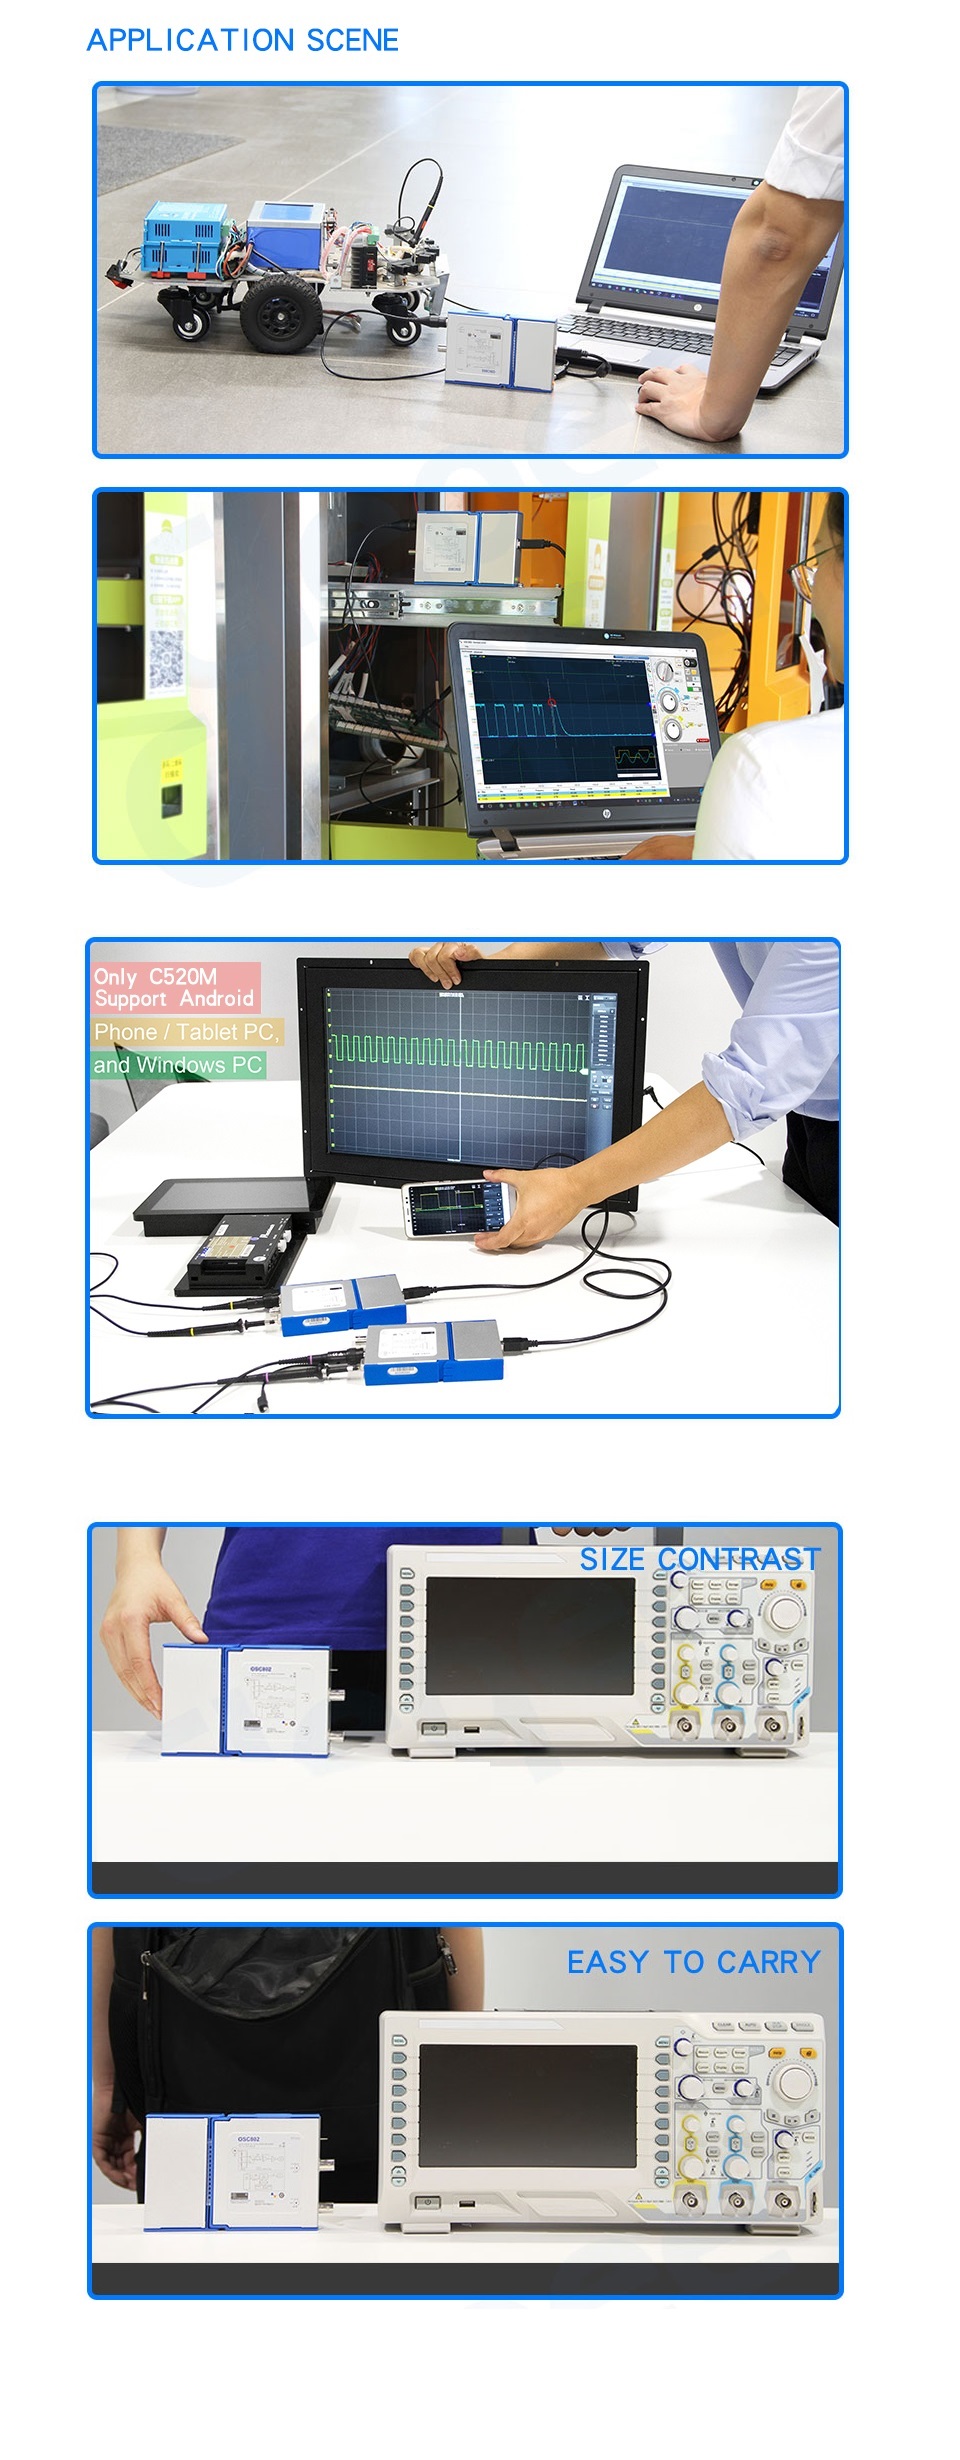
C520M can’t support all kinds of Android devices. Customers may need to check their Android phone/Tablet with these requirements, or check the support list.
Device Operative System |
Android API 16+ (Android 4.1) |
Device Kind |
Phone, Tablet, TV Box |
Device Specifications |
USB OTG Support, 2GB RAM or more |
USB OTG Cable |
B type male to micro c , type c or others(depend on your Android device) |
USB Oscilloscope |
LOTO OSC482M |
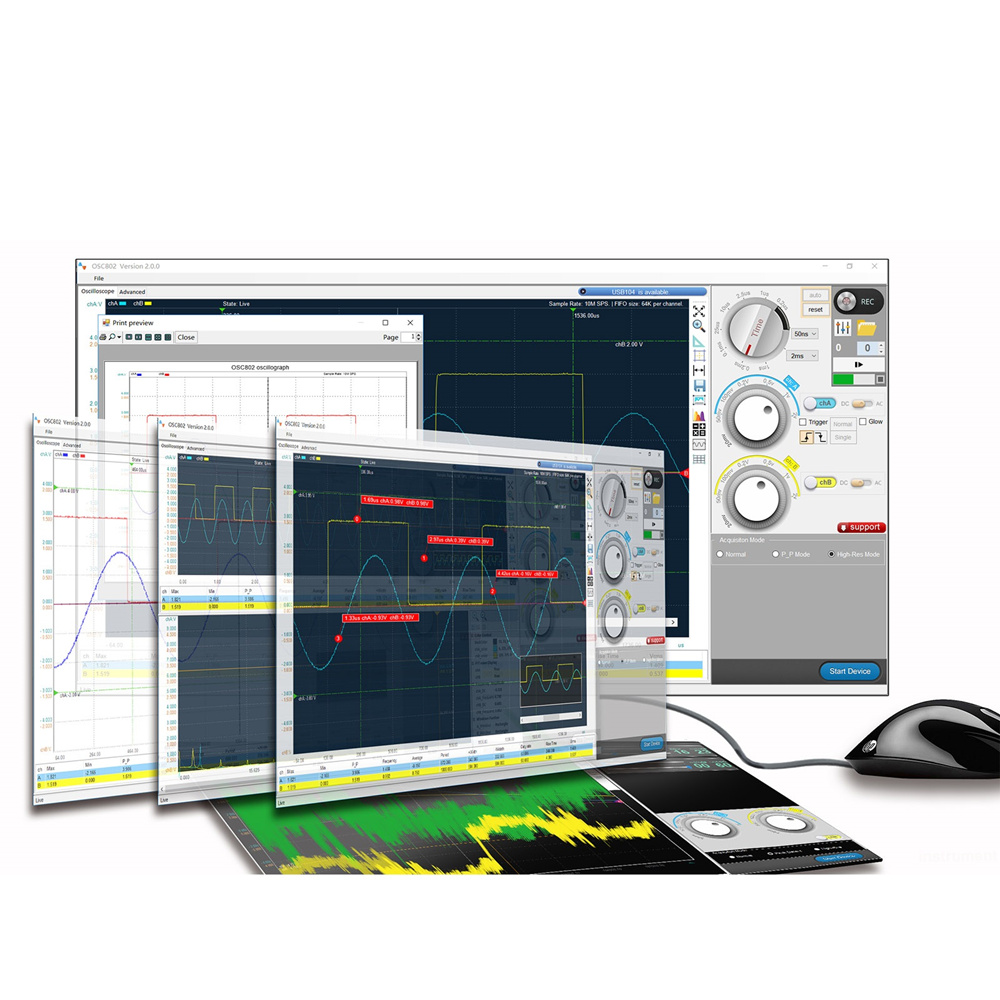
App Specifications:
High Frame Rate |
Real-time oscilloscope, up to 500 scans per second and 25 FPS. |
Input Range |
±250mV to ±5V (for X1 probe). |
±2.5V to ±50V (for X10 probe). | |
±25V to ±500V (for X100 probe). | |
Sampling Rate |
500Sa/s to 48MSa/s. |
Memory Length |
1024 Samples. |
|
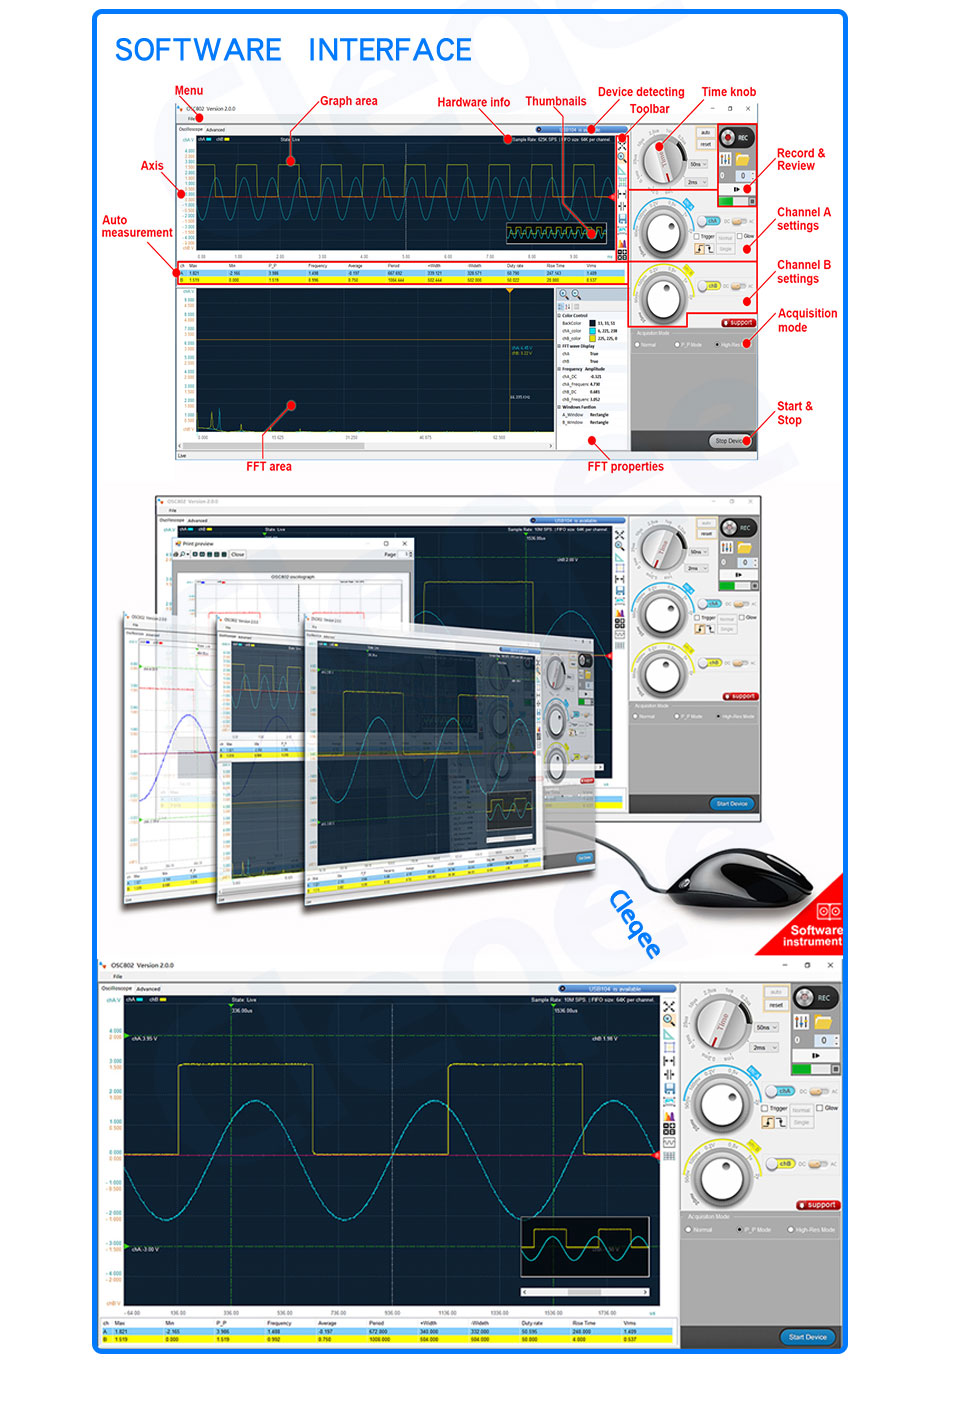
Software trigger and AC/DC |
Improved software trigger with stabilizer. Auto, Normal and Single Trigger modes.AC/DC control. |
Full statistics |
Peak-Peak, Max, Min, RMS and DC value. Frequency and duty cycle. Cursors for manual calculations. |
FFT |
Real-time processing with the possibility to select among several windows. Peak detects and Peak-hold functions. Available only for Channel A. |
Sinc Interpolator |
Sinc interpolator with infinite sampling rate for the best signal view. Maximum visible frequency = Sampling rate / 4. |
Phosphor decay effect |
Plot multiple signal traces on the screen. |
XY Plot |
Calculate and visualize difference among 2 signals, amplitude, frequency, phase and delay. |
Math functions |
Apply operations on single or both channels: invert, +, -, x, : |
Probe setting |
Direct calculation of current value according the probe setting used (x1, x10). |
Data export |
data available in .csv and Matlab format. |
Calibration |
Calibration function available. |
Other |
Screenshot function. |
This is a device list of updates we currently maintain.

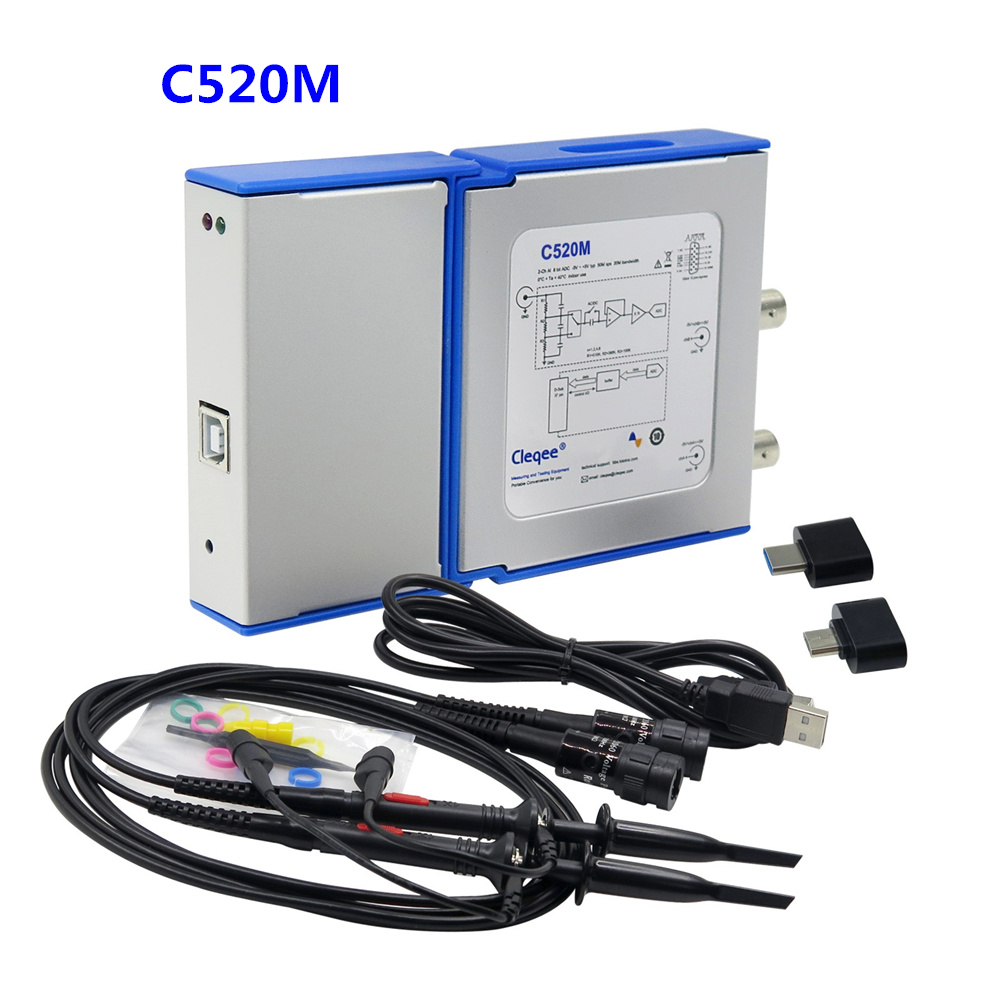
Package Includes:
AS the pictures shown below